15 Vital E-commerce KPIs for Sales and Marketing
to Efficiently Monitor Your Business Performance

 17 mins read

15 Vital E-commerce KPIs for Sales and Marketing
to Efficiently Monitor Your Business Performance
17 mins readThe success of your brand depends on how you achieve your objectives. Are you heading in the right direction? If not, where have you gone off course? In order to answer these questions you need to track Key Performance Indicators, or KPIs, for an e-commerce website, to help you estimate even the difficult-to-measure objectives. First and foremost, you need to monitor KPIs for sales and marketing since they’re the most important KPIs for e-commerce. Here we tell you how to track them quickly and effectively.
If you want to know how to keenly watch the development of your online store, what e-commerce KPI metrics to focus on, and how to calculate them properly, you are in the right place! This article gives you detailed answers on the following questions:
What gets measured gets improved.
No matter what business you’re running, B2C or B2B, KPI for e-commerce companies refers to a gauge that illustrates how efficiently your brand is working following its business strategy. It also identifies your business’s ability to achieve its goals over an interval of time and within a fixed budget.
E-commerce KPIs give objective numbers about how your sales are going, how successful your production process is, whether your customers are satisfied, whether your digital marketing approach is going the way you are expecting, and how effectively your team works.
Watching key performance indicators is not just a question of staying competitive or outrunning other brands. It’s about being successful and profitable. The Economist Intelligence Unit’s data shows that 59% of owners are convinced that analytics and data are “vital” for their companies, the other 29% have insisted that it’s “important”. Why do people bother with it? By monitoring e-commerce KPIs metrics, you can do the following:
When running an e-commerce company, you likely want to outline some goals. Close monitoring of these metrics allows you to follow up on your store’s progress and understand whether you are still pursuing your scheduled course or if you’ve perhaps gotten a little sidetracked.
Your site may show poor efficiency for a variety of factors: high page load time, very few subscribers or ad returns per month despite high spending on marketing, a lot of long-sitting products, or poor traffic from a blog, for example. By tracking e-commerce KPIs, you can uncover these problems. For instance, a high rate of cart abandonment results in lowering the number of potential customers and sales as well.
Numbers can bring you both good and bad news: they show your successes as well as failures at certain stages of your business development. You will understand the strong points of your brand, and know which approach is right and generates profit. For instance, a high click rate of marketing emails indicates the efficient work of your marketing tactics. KPIs for sales and marketing can help you in this aspect.
It all comes down to money. No matter whether it’s revenue per visitor, return on marketing investment, cost of goods sold, or average margin, every e-commerce KPI metric displays the information about both your income and expenses. Thus you can understand, for instance, what type of customers bring you more money, when sales tend to reach their peak and when they drop, and how many website visits you get per day/month/quarter. It provides you a full picture of your finances.
This one’s the last but certainly not the least. The success of your brand depends on a variety of factors: strategic brand management, your team performance, their awareness of your business objectives, and their desire to bring value. Since your company consists of different departments, tracking a particular set of e-commerce KPIs will be useful for each unit. Your team will know precisely what they can enhance or change to strengthen your e-commerce performance.
Therefore, e-commerce KPIs tracking helps you make more money and gratify more customers by way of improving certain parts of your business – sales, marketing, customer service. KPIs give you precise numbers, which are necessary to consult for business improvement. Metrics are another helpful tool serving to monitor your business progress. However, KPIs and metrics are different things.
KPI can be metrics, but not every metric is a KPI.
Metrics can turn into KPIs only when they are connected to a significant part of your brand – sales, manufacturing, distribution, and so on. If the metric reflects the status of any crucial business part, it’s a KPI.
Every KPI shows the efficiency of your team’s efforts, what results you achieve, and the value that your team brings to your company. KPIs deliver useful, actionable data, while metrics give an overall picture of your company’s situation.

Let’s compare two metrics: lifetime value or LTV and Facebook page views. LTV gives you information about how much the customer brings you, while the second metric shows how many people have visited your brand’s page on Facebook. Both numbers are important but only LTV is defined as an e-commerce KPI since it’s closely connected with your revenue.
Based on the type of business, and your requirements and desired outcome, you can dive deep into one KPI, and pay less attention to others. We understand that for you, as an e-commerce owner, KPIs for sales and marketing most likely come first.
To help you determine the level of your business objective achievements, we’ve compiled an e-commerce KPI list with tools to monitor your performance.
These top e-commerce KPIs give you precise data about your revenue, sales, and conversions. Tracking them carefully will help you avoid potential financial problems. Below we list key KPIs for e-commerce sales and explain how to monitor them.
You should watch your sales progress while taking into account different parameters: time, type of customer, product, location, type of payment. This way will help you figure out useful information like profitable sales channels, the most lucrative period, best-sellers, and average revenue per sale.
What are the best tools to track sales? HubSpot CRM, Thryv, Pipedrive, Freshsales, Zendesk Sell, Bpm’online.
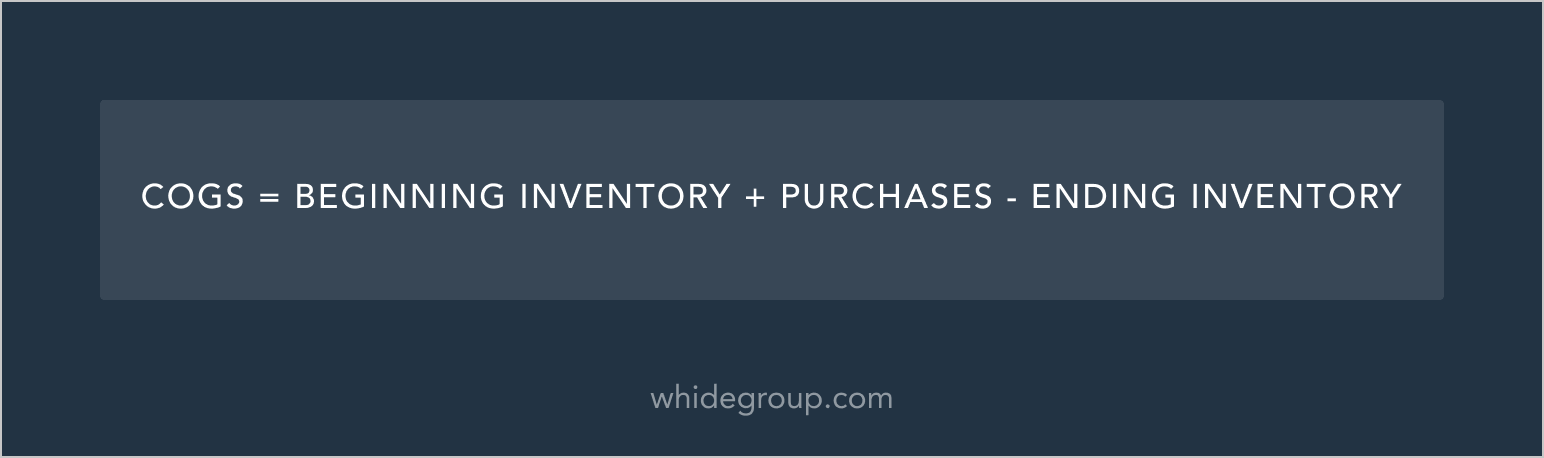
This refers to the total costs that you’ve spent to make a product or service. Here, expenses for manufacturing, distribution, sales force, employees wages, and inventory are taken into account. By tracking COGS, your partners, analysts, a sales team, and managers understand the company’s bottom line. How do you calculate COGS?
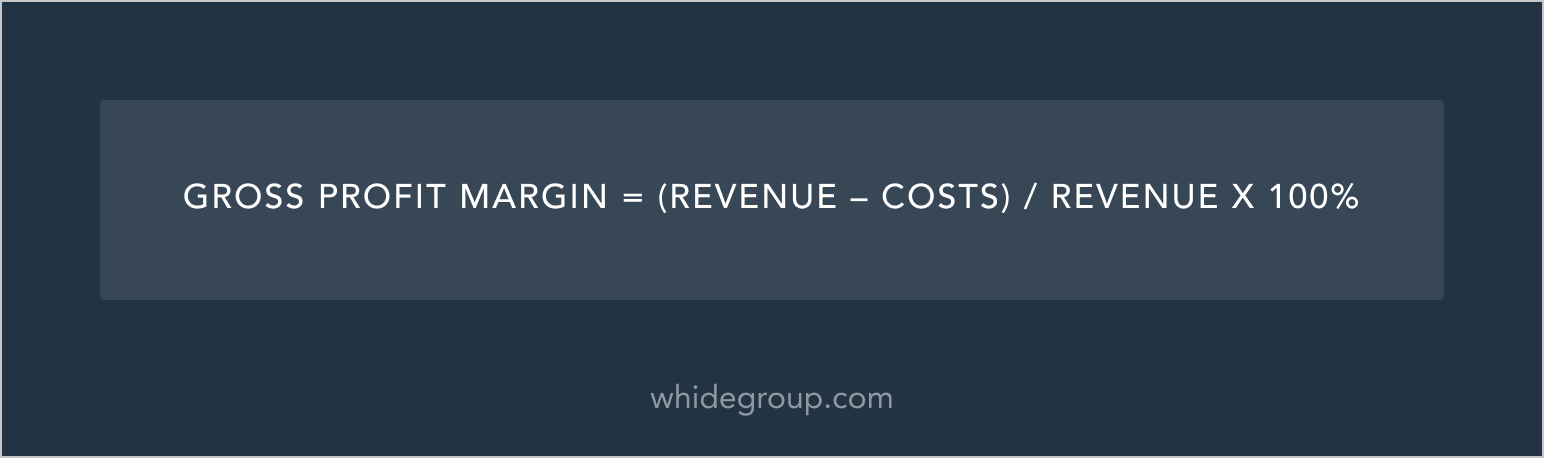
Gross profit margin indicates the percentage of your true profit, or, real income. Remember: it’s not the same as revenue. Profit is calculated by subtracting the total expenses from the revenue or total sales. The gross profit margin shows how much money your business brings you and how healthy it is. In order to calculate the percentage of the gross profit margin you need the following formula.
Being one of the main KPIs for e-commerce, CVR reveals how successful your site is among visitors, and how many users are converting into leads or buying from your brand. All in all, you will know how your website is performing. To gain deep knowledge of the company’s progress, your team should monitor different types of conversions such as interactions per visit, new visitor CVR, conversions by device type, traffic source, and so on.

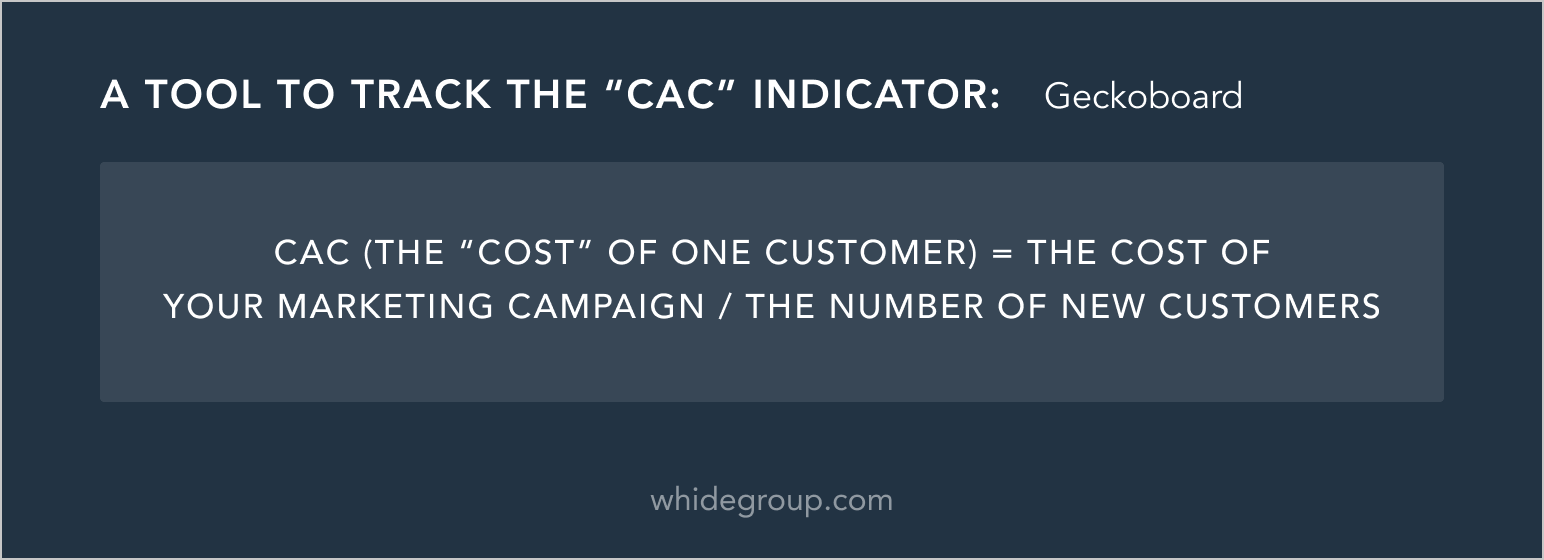
Here you are counting the costs of acquiring a customer. By knowing this indicator, you can create as well-designed strategy to “purchase” your customers based on a number of required clients and approximate marketing budget.
This metric shows how much your consumers are ready to pay for one order and delivers a better understanding of buying behavior, therefore helping you to adjust your sales strategy. You should strive to increase this number in order to boost conversions and be able to cope with high CAC.

Here you find out how much revenue a single customer can bring you. By identifying CLV, you can define the most profitable groups of buyers and put your marketing efforts towards nurturing them: women/men, youngsters/middle-aged/older, low income/high income, local/international customers, interested in cars/sport/healthy lifestyle, etc. Thereafter, you get loyal customers who bring more income since they’ve purchased for a long time. The more regular customers, the more CLV you get.
Online calculators: CLTV calculator, ChartMogul calculator, The SaaS CFO.

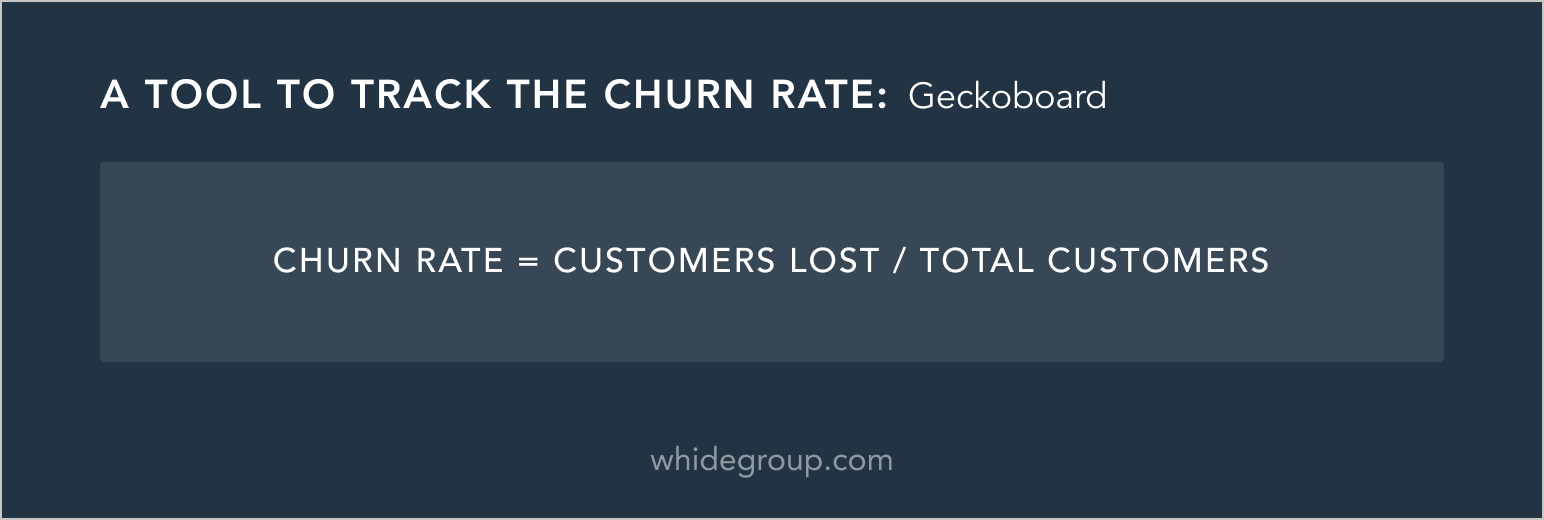
Churn rate refers to the percentage of customers who have stopped using your company’s services, deleted their account, or unsubscribed from your newsletters. The lower churn rate you keep, the more successful the brand is. With a high churn rate, your sales will be lower. That’s why it’s good to talk sincerely to your clients and find out what annoys them and what pains related to your company they have: long shipping time, low performance, poor customer service, poor website responsiveness and navigation, or perhaps something else entirely.
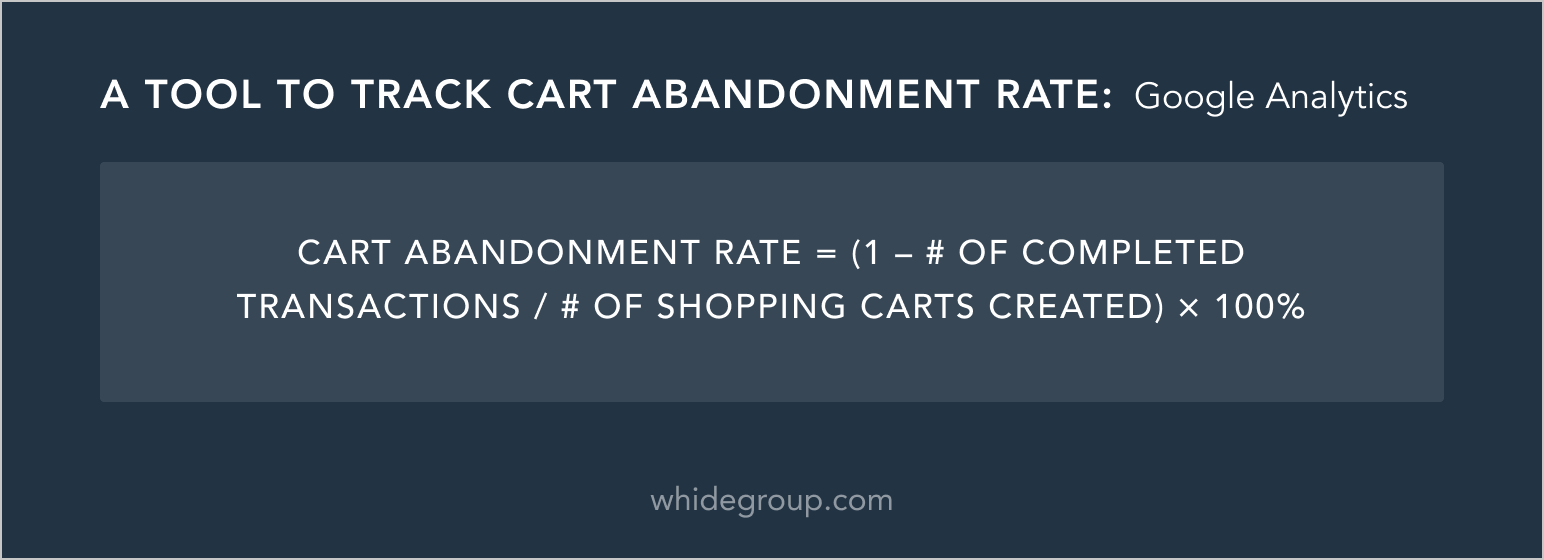
Here you can find out the ratio of visitors who add products to their shopping bags but don’t check out. In 2018, approximately 69% of users abandoned their shopping cart due to various reasons, from a long checkout process and pushy upselling during transactions to finding a better price on a competitor’s site. Only 7.5% of those who left the online store returned to finish their shopping. This low number recalls the importance of monitoring this indicator. A high rate is a warning sign that requires you to engage and enhance the checkout experience.
Product affinity shows precise results of what goods your users like to buy together. You can use this metric to build an excellent profitable cross-selling strategy. It may increase your income by 10-30%. After creating winning product bundles, you will boost your sales and bring consumers more value.

Time to purchase calculates how long it takes for a visitor to turn into a customer. It should be noted that within a particular period of time or the same customer group, this indicator will be different. Why? Some users tend to do instant purchases – two clicks and they turn into customers. While other users may visit your site several times before buying. In order to reduce this time, you should strive to optimize your sales process.
A tool to track the “Time to Purchase” KPI: Google Analytics.
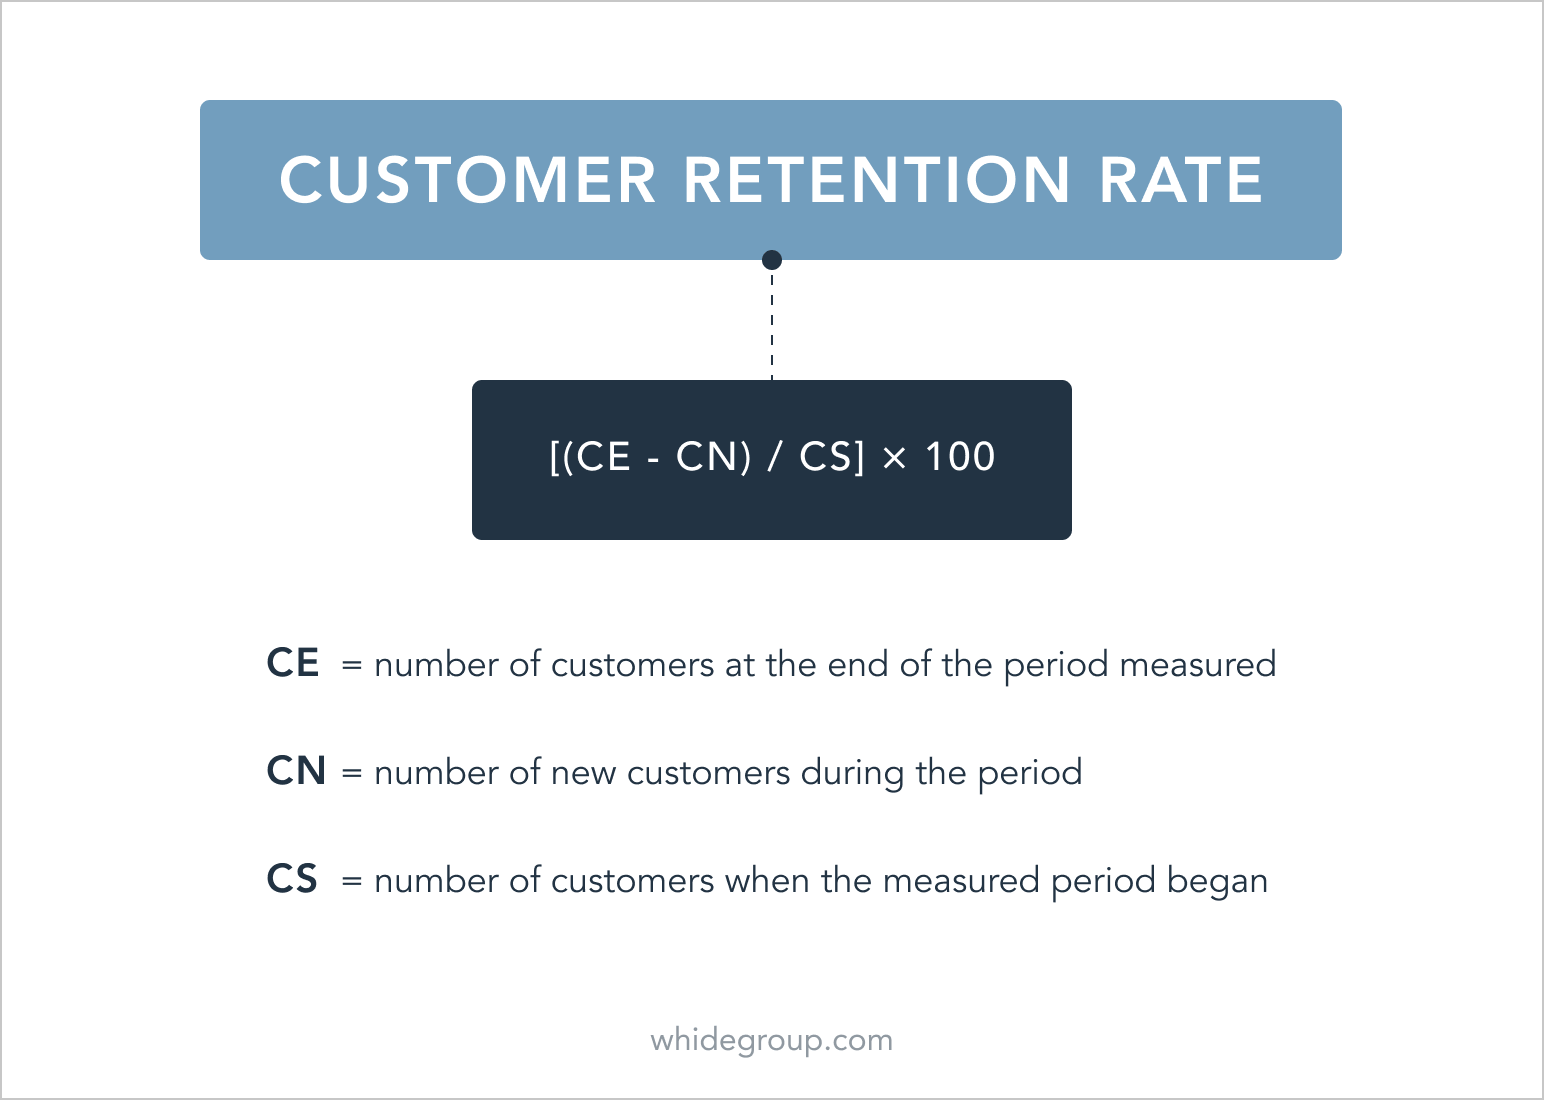
It ties to the percentage of customers who come back to your brand again. The indicator shows the current outcome and efficiency of your previous activities. For instance, if you ran a sales campaign three months ago and your retention rate is 40%, it implies that your marketing and sales activities were efficient! You should remember that attracting new clients to your brand is harder than satisfying old ones. Constantly monitor customer retention rate, offer better products, and improve customer service, and keep that rate high!
When you want to compete with other companies in your niche, you need to sell products in approximately the same price range. By the way, be careful about selling at a very low price. While customers love a good deal, a product that is too cheap will scream “poor quality.” Instead, consider another strategy: sell higher. And then you may offer high-quality customer service, gifts and discounts for returning buyers, or a customer loyalty program. Your customers will be thrilled. Monitor the price of your competitors and find your balance.
Tools to track this indicator: Prisync, Omnia, PriceEdge, SellerRepublic, JDA.
Above we’ve mentioned the best KPIs for measuring the performance of your e-commerce business. They help you analyze your sales thoroughly and from various perspectives. Once you have the data, examine the received results to identify achievements and weak points on the sales side. While your sales team is working over this analysis, your digital marketing team tracks and examines marketing KPIs.
The metrics described below are actually a must in order to gauge the success of your digital marketing. With the help of simple formulas and different tools, your marketing team shouldn’t experience any difficulties tracking e-commerce KPIs.
Brand awareness indicates your brand’s performance on social media and search engines – shows how many customers recognize your company’s name. In order to keep this KPI high, you should run effective marketing and advertising campaigns for your name to become well known. The more knowledge people have about your product, the more likely they are to buy from you.
Tracking tools: Google Analytics, Alexa, Moz; Keyhole for Twitter and Instagram, Hootsuite and Fanpage Karma for all social media accounts.
How to measure brand awareness?
Being a crucial e-commerce KPI, this indicator illustrates the number of real people who visit the site per day, week, and month, or over the holiday season’s sales. In order to have consistent site traffic and, therefore, stable turnover, you need to carry out marketing campaigns to boost brand awareness.
Tools to monitor the KPI: Google Analytics, Alexa, SEMRush, W3Perl, SitePrice, and more.
We use it to find out the ratio of visitors who, after viewing a single page, exit the site. This KPI for e-commerce companies reveals your true success online. The statistic can be disheartening: e-commerce and retail sites tend to have a fairly bad bounce rate – from 20% to 45%. On top of this, Google’s engine doesn’t like sites with high bounce percentage, and lowers their rank in search engine results as a consequence. What are the reasons? The most obvious and widespread one is website problems that undermine all your efforts. If the loading time of your product pages is more than 3 seconds, a mobile version of your website is not optimized, or your webpages have irrelevant keywords, expect increasing bounce rates. Keep the rate low and your ranking in search engines will be high.
Tools to track the “bounce rate” indicator:Google Analytics, Monster Insights.

It demonstrates how many users come to your site from their mobile devices. Here the performance of the mobile version is as significant as powerful marketing or ad campaigns since Google gives priority to the sites that are mobile-friendly and optimized. By tracking the traffic from your site’s mobile version, you will know how successfully users interact with it. In the case that the indicator of desktop traffic is significantly higher than the mobile one, it means that your mobile website is not optimized or requires crucial improvements. Mobile optimization is essential for e-commerce because so many people shop via their smartphones and tablets.
A tool to track mobile site traffic: Google Analytics.
It illustrates how many pages a single user or a particular group of customers usually visit per one session. You can track it by demographic, age, country, and region. The indicator demonstrates how interesting and useful the webpages are. Of note – the more engaged your visitors are, the higher this KPI is.
Tools to track this indicator: Google Analytics, Monster Insights.
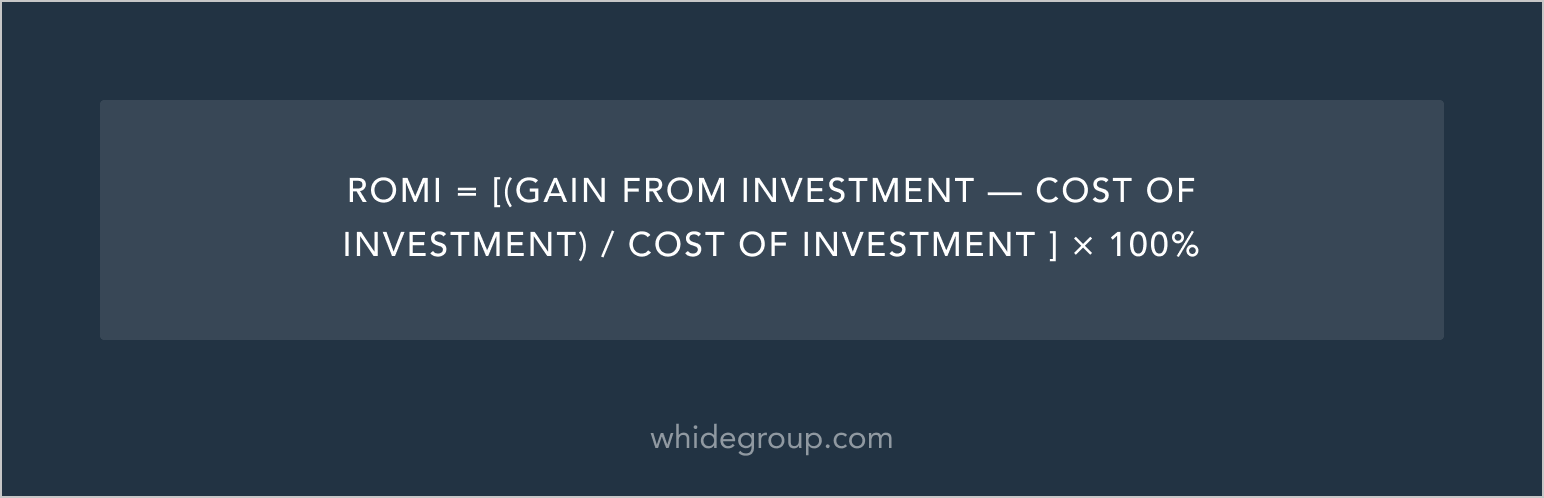
In order to know whether your investment in certain marketing activities is worthy, you can’t ever skip monitoring this KPI! We use this rate to track the performance of our digital marketing approach. Here, a high percentage is always better: if the rate is above 100%, congratulations! – you’ve invested money into a prosperous campaign.
Pay-per-click is an essential indicator for those who run an advertising campaign in both SM and search engines. CPC refers to the cost that you pay when people click on your ad. In other words, it demonstrates how much money it takes for you to “buy” one user for your company.
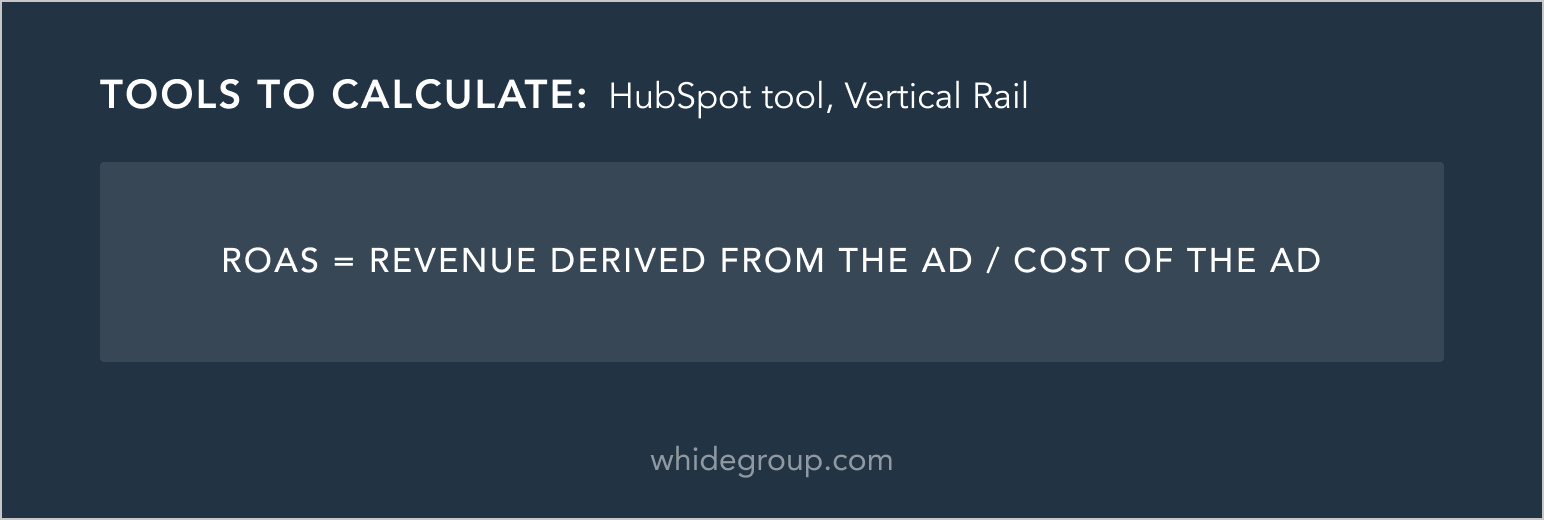
It often happens that acquiring more customers and increasing sales requires running an advertising campaign in search engines. If you do, you certainly want to know how much revenue it brings. Return on Ad Spend refers to an amount of money that you get for every cent spent on ads. It helps you realize whether your campaigns are profitable and efficient, or not. Here, like with the previous KPI, the higher number you get, the better.
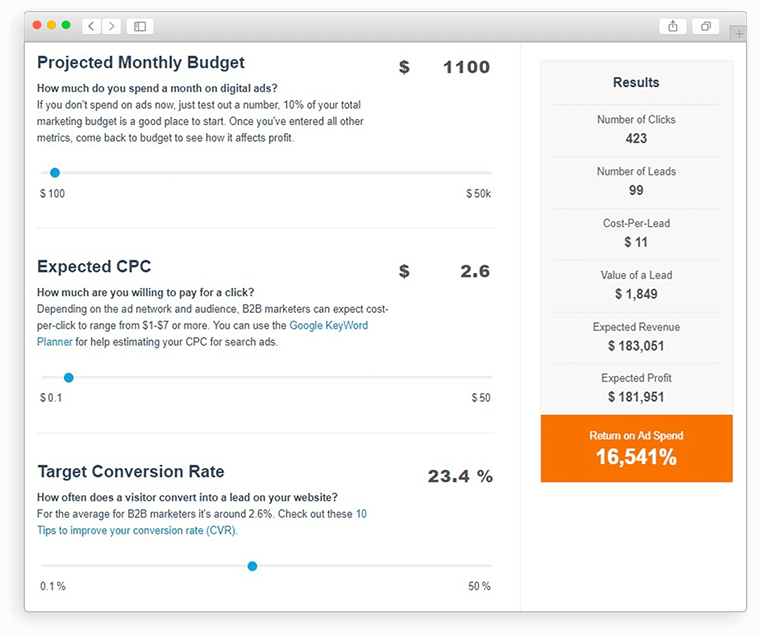
Here is a HubSpot calculator which helps you identify whether your advertising campaign is worth the money you spend on it. The tool takes into account many factors such as expected CPC, average sale price, projected monthly budget, and more. After you set all required configurations, you get the following results.
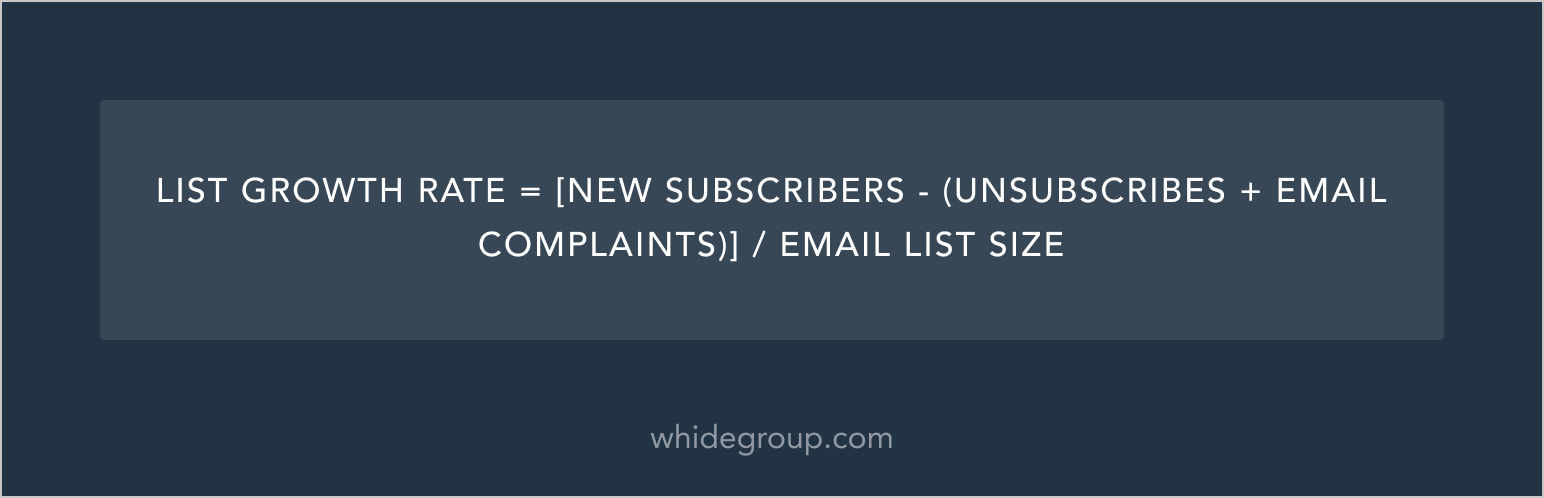
After sending any emails about new arrivals and gifts or promo offers to your target audience, your team tracks the percentage of people who become subscribers jumping onto your email list. It can consist of different customer segments. If so, track this KPI for each group. All in all, with this KPI you will see what email marketing approach works as it should and what parts should be improved to engage potential customers.
When you provide a high-quality social media campaign, it renders great, positive results: you earn followers. This indicator shows not only how many fans you get, but also how loyal your buyers are and how familiar they are with your product. The more followers the better, no? Actually, this isn’t always the case. You may have 12k followers on Facebook but low engagement. This implies you need to change something in your Facebook marketing tactics. The extra effort will be worthwhile because positive social media engagement by happy customers is a great way to gain new customers, which leads us to the next point.
Social engagement refers to the percentage of interaction between your brand and your audience in social media. Here your social media manager calculates how many comments, likes, shares, clicks, and brand mentions the post on your business page gets. When you’ve got, for example, 550 followers of your business account but only 11 likes and 1 share, it doesn’t look good because it means that people don’t care about your product. By tracking social media engagement, you will reveal your weak points and be able to change your SMM strategy to make more people interact with your brand.
You can monitor your social media activity directly on social networks or use analytics tools such as Keyhole, Fanpage Karma, or Hootsuite.
Being a vital part of your website, the blog should not only educate and entertain, but also acquire new customers. Tracking overall blog visits, average views per post, top viewed posts, and the number of blog subscribers and social shares, you will realize how prosperous your blog is and the volume of potential customers from your blog. To know the numbers, you just need to adjust your main analytics tool to track the blog traffic.
This indicator shows the number of users who want to receive your newsletters. In addition to getting more subscribers to build your email list, these users consistently go to your website, increasing traffic. Additionally, because they have shared their personal data, it gives you the opportunity to more easily reach your target audience. Bonus? More subscribers means more potential customers.
You can track your email subscribers using your analytics tool, for example, Google Analytics.
We understand that you are unwilling to lose potential customers and the last thing you want to see is them unsubscribe from your newsletters. Even though it’s an inevitable thing, you need to do your best to keep the rate low. Tracking and analyzing your unsubscribers – who they are, the reason they are leaving, and when it happens – helps adjust your email strategy to improve customer experience and avoid mistakes in the future.
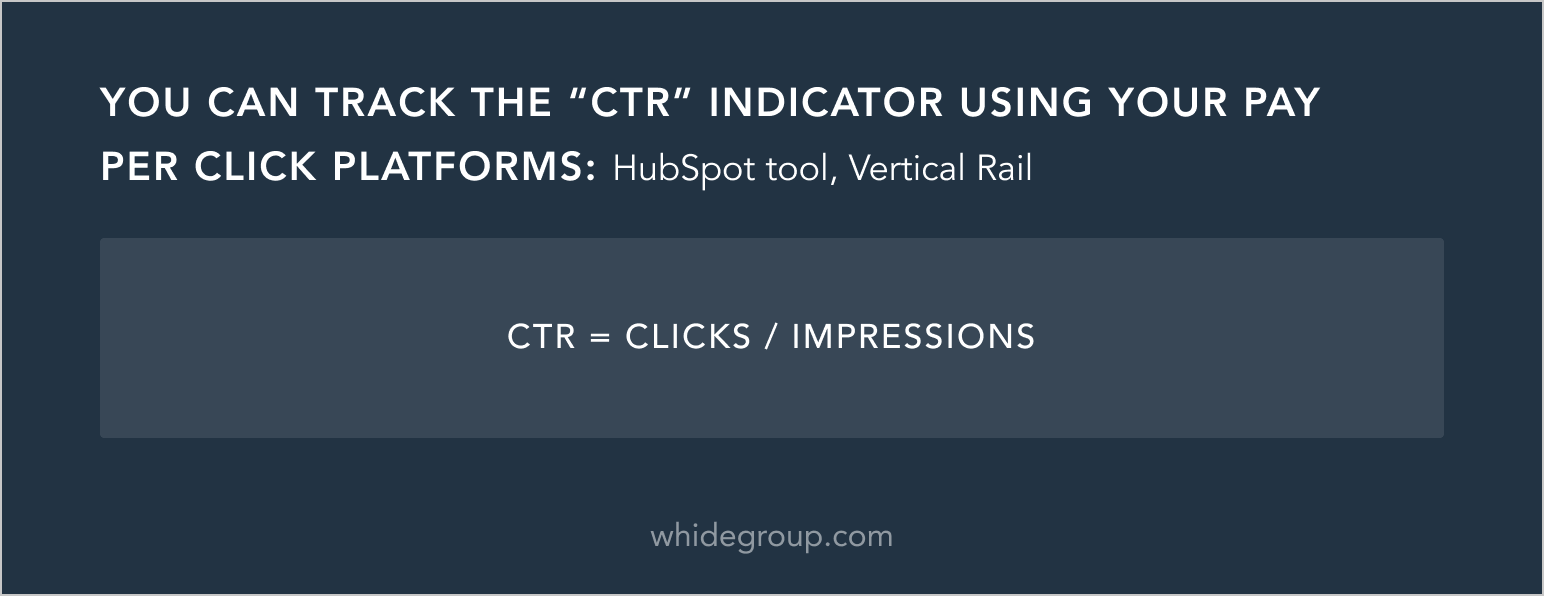
CTR illustrates the ratio of all clicks on your advertisement to all of its views. Low CTR shows that viewers are not engaged and aren’t interested enough to click on the ad. If it’s the case, it’s time to change your ads content to make it a bit more alluring.
As one of the most important KPIs for e-commerce, reviews are the driving force behind your brand. They help to maintain your brand’s reputation and stay competitive on the market. Viewing other customer reviews, users will start to trust your company, therefore sales for the product increase. Consider this remarkable example: one of our clients noticed sales boosts after certain office furniture products got positive customer reviews. The sales for these products increased by 37%, and 21% for the office furniture as a whole! Encourage your customers to leave their review with CTAs or gifts.
Tools to monitor customer reviews:TrackStreet.com, BirdEye.com, Brandwatch.com, Intercom.com.
It refers to the rate of how many unique views your posts, stories, videos, or advertisements get. Tracking this KPI, you will determine the right/wrong time and type of content that allows you to reach a wider audience and please your fans at the same time. In your social media accounts, you can see not only the number of reached users but also how effective every reach was – followers, website clicks, likes.
Among all these top e-commerce KPIs website traffic goes first since it’s really a critical marketing indicator. The more people who land on your website, the greater potential for sales. That’s why your site must be fast and optimized to keep users and convert them into customers. High website performance has a positive impact on KPIs.
Excellent website performance results in great user experience, higher conversions, and high return visits, so keep it top-level. On the other hand, low performance causes not only a drop in sales but also damage to your store’s reputation. 79% of users won’t come back to a slow website again. Plus, 44% of customers share their impressions about their unsuccessful experiences with friends. To decrease this percentage and satisfy more customers, optimized website performance is a must.
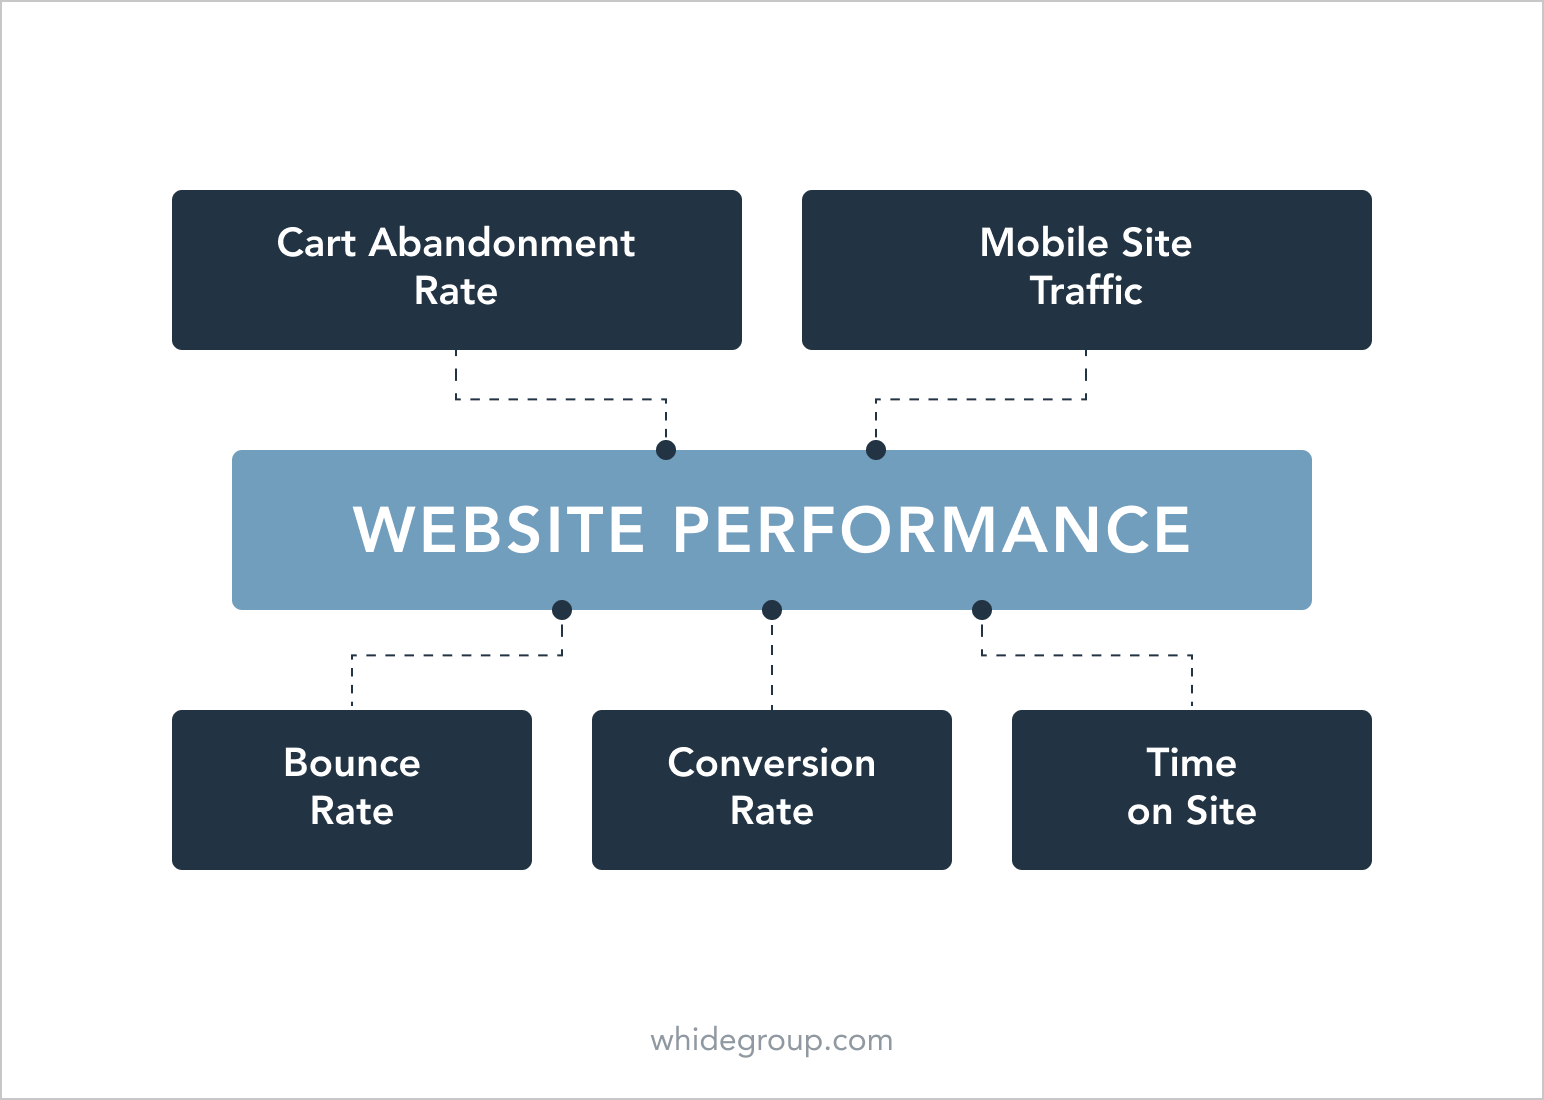
Your site performance has a direct, strong impact on important KPIs for e-commerce such as website conversion rate, time on site, mobile site traffic, cart abandonment rate, and bounce rate. Below, we offer you recommendations about how to boost these KPIs via performance optimization.
To improve your websites conversion rate and lower the bounce rate, you need to speed up load time for your site. High website speed can be achieved through image optimization, merging CSS and JS files, server configuration, caching implementation, code optimization and much more.
A Magento 2 project we’ve recently worked on was riddled with website speed problems. After we optimized product and homepage images, and deferred CSS-styles and JS-scripts, the load time reduced from 14.8 sec to 4.0 sec. This led to increasing the website speed and therefore a boosted conversion rate – the brand experienced up to 11.3% in conversions the following months and the bounce rate fell by 9.7% respectively.
If you want to increase the time that users spend on your site, certainly boost your website speed. How? In addition to the above-mentioned optimization activities, you also should refactor the code, choose a reliable hosting server, use Full Page Cache, and make a few other changes. You can also use a lazy loading optimization technique. It helps reduce the page weight by first only loading the non-critical content that a user sees immediately without scrolling. Only when they start to scroll down, the remaining content is loaded.
We implemented this technique while working on a Shopify project. Through implementation of this method, we reduced the webpage weight to 18%. Consequently, website performance doubled and time spent visiting the site increased by 70 sec.
We implemented the last technique while working on the Magento project mentioned previously. We completely removed the footer and header from the checkout page leaving only the logo and a phone number. It increased web page performance by 4 sec. While 4 seconds doesn’t sound like much, this optimization resulted in the cart abandonment rate decreasing by 14%.
Mobile performance optimization gives you a chance to get higher mobile traffic and attract more qualified leads who subsequently turn into customers and promoters. You can optimize the mobile version of your website using standard techniques such as minifying JS, usage of a Content Delivery Network, optimizing product image size, inlining critical CSS, deferring JS, and many more. In addition to the ways mentioned above, we also recommend implementing a Progressive Web Application or PWA to improve your mobile site performance. Although it has the appearance of a native mobile application, it is much lighter, so the PWA provides an awesome mobile user experience.
Another way to optimize website speed is by using accelerated mobile pages (AMP). The technology is welcomed by Google as websites that have AMPs are ranked higher in the search engines. Moreover, such pages are compatible with almost all browsers, can load five times faster, and reduce bounce rate. Implementing this technology into our client’s website resulted in a 136% improvement in website performance.
In this article, we’ve reviewed the best KPIs for e-commerce websites including KPIs for sales and marketing that will help you monitor your brand’s success. Some indicators may be vital for your e-commerce company, some of them are less critical. Their priority and value are closely tied to your industry, strategy, and objectives.
After you’ve defined the relevant e-commerce KPIs and metrics to track, start to monitor them immediately so as not to waste any time. If you make it a regular exercise, you will be informed about every step of your brand’s performance and find new means to successfully grow your company.
If you would like assistance getting your website to perform better than ever, drop us a line. We’d love to help!
![]()

 5 Multichannel E-commerce Techniques to Grow Your Brand


Valuable information. Lucky me I found your website by accident, and I am shocked why this accident did not happened earlier! I bookmarked it.
Pretty nice post. I simply stumbled upon your weblog and wanted to say that I’ve really loved surfing around your blog posts. In any case I will be subscribing in your feed and I am hoping you write again very soon!|